Meaning of a Flowchart: A flowchart is a diagrammatic representation that illustrates the sequence of operations to be performed to get the solution of a problem. Flowcharts are generally drawn in the early stages of formulating computer solutions. Flowcharts facilitate communication between programmers and business people. These flowcharts play a vital role in the programming of a problem and are quite helpful in understanding the logic of complicated and lengthy problems. Once the flowchart is drawn, it becomes easy to write the program in any high level language. Often we see how flowcharts are helpful in explaining the program to others. Hence, it is correct to say that a flowchart is a must for the better documentation of a complex program.
The Flowchart Symbols: There are six basic symbols commonly used in flowcharting of assembly language programs:
1. Terminal
2. Process
3. Input/Output
4. Decision
5. Connector
6. Flowchart
You will use these symbols throughout the next two units (Unit 2 and Unit 3). Below is a reference you must refer to when drawing and creating your flowchart symbols.
Terminal Symbol:
 |
This symbol shows where a program begins and
ends. Labeling: When used to identify the beginning and end of a whole program, the beginning terminal is labelled with start and the ending terminal is labeled with end or stop. When the flowchart is for a module, the beginning terminal is labeled with the module name and the ending terminal is labelled with return or exit. |
 |
Used to show tasks such as calculations,
assignment statements, incrementing, etc. Labeling: Processes are labeled with the statement the task to be performed, for example: totalSales = subTotal + pstAmount + gstAmount recCounter = recCounter + 1 firstName = "Sally" |
 |
Used to show an operation that brings data
into a program, or an operation that sends data out of the program. Some example are, getting values from the user or printing something on the
screen. Labeling: Input/output symbols are labeled with the
statement that receives the input or generates the output, which could
also include opening files and devices. Examples: Read employeeName Write Total |
 |
Used to identify a point in the program where
a condition is evaluated. Conditions are used in if statements and
looping. Labeling: Decisions are labeled with the condition
that they are testing, for example: numRecords > 10 foundMatch = true |
 |
Used to connect two segments of flowchart that appear on the same page. This is done when your flowchart runs to the bottom of the page and you're out of room: end it with an on-page connector and then place another on-page connector in a free spot on the page, and continue the flowchart from that connector. Labeling: On-page connectors are labeled with upper-case letters. The connector at the end of a segment of flowchart will match the connector that identifies the rest of the flowchart. For example, when you run out of room, end the flowchart with a connector labeled "A". The flowchart continues at the matching connector also labelled "A". |
 |
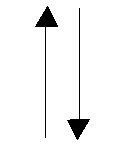
Used to connect flowchart symbols together. Only one flow line is used in conjunction with terminal symbol.
Labeling: Flowlines indicate the directionof the data flow. This represents the sequence of available information and executable operations. The lines connect other symbols and the arrowsheads are mandatory only right-to-left and bottom-to-top flow. |
|
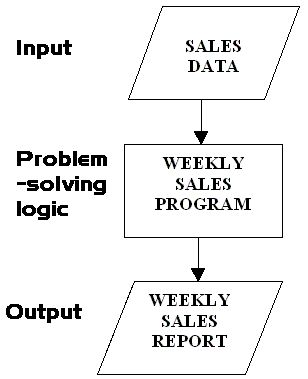
The System Flowchart: is designed before a program flowchart and is developed to solve and show the problem in a small and quick way.
 |
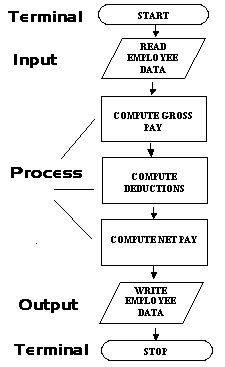
The Program Flowchart: Is the actual processing steps within the problem-solving logic. Program flowcharts are developed in more detail showing every design symbol that is needed.
 |
1. All boxes of the flowchart are connected with arrows. (Not lines)
2. Flowchart symbols have an entry point on the top of the symbol with no other entry points.
3. The exit point for all flowchart symbols is on the bottom except for the Decision symbol. The Decision symbol has two exit points; these can be on the sides or the bottom and one side.
4. Generally a flowchart will flow from top to bottom.
5. Connectors are used to connect breaks in the flowchart. Examples are: from one page to another page, and from the bottom of the page to the top of the same page.
6. Subroutines have their own and independent flowcharts.
7. All flowcharts start with a terminal.
8. All flowcharts end with a terminal.
Pseudocode: Is also the actual processing steps within the problem-solving logic. It is code that consists of English-language statements that describe the process steps of a program in paragraph form.
Pseudocode is a kind of structured English for describing algorithms. It allows the designer to focus on the logic of the algorithm without being distracted by details of language syntax. At the same time, the Pseudocode needs to be complete. It describes the entire logic of the algorithm so that implementation becomes a rote mechanical task of translating line by line into source code.
In general the vocabulary used in the Pseudocode should be the vocabulary of the problem domain, not of the implementation domain. The Pseudocode is a narrative for someone who knows the requirements (problem domain) and is trying to learn how the solution is organized.
Programming - Day 4 Example Problem #1 Flowchart (The Tip Calculator):
Example #1 Flowchart (The Tip Calculator): At this time students will be asked to get a flowchart paper and will be working to complete and create a system flowchart, program flowchart, and pseudocode for the a Tip Calculator. The class will work this structure design problem together.
Directions for turning in Example problem - In the classroom: In this example problem you will just turn in you written flowchart for example problem 1.
Directions for turning in Example problem- Virtual:
Virtual No Printing just upload the assignment files to Canvas Module 1 Example Problem 1. You will NOT need to print out any documents just submit this assignment in the Canvas drop box. Note you should have 1 screen shots: example 1 flowchart. Put the screen shots (images) in a Word Document and send me the file. Save the Word document as the example problem: Example Problem 1 to Canvas Programming Module 1 drop box. Please note, that you will need to re-save this file as a pdf file before uploading. Here is an example video on how to do that: See Video > > >  How to save a Word file to a pdf right click mouse and select... (Open link in new tab)
We will use this Example Problem 1 flowchart to code this program with Mr. Proctor using the Visual Basic program and the Console Application template.
Teacher's Comments: Throughout the next two units you will be asked to complete system flowcharts, programming flowcharts, and Pseudocode. To become a programmer you must identify these steps in writing and building programs on paper.